

TL;DR:
- Packaging’s carbon footprint includes emissions from all lifecycle stages, not just manufacturing.
- Most packaging emissions are in Scope 3, linked to raw materials, transport, and disposal.
- Reducing packaging emissions requires cross-team collaboration, accurate data, and targeted supply chain improvements.
Switching your packaging material to something labeled ‘eco-friendly’ feels like progress. For a lot of retail brand owners and foodservice operators, it is the first step taken and the last one measured. But material swaps alone rarely move the needle on your actual carbon emissions. Most packaging carbon output is driven by decisions scattered across your entire value chain, from raw material sourcing to how your customer disposes of the bag at home. This guide breaks down what packaging carbon footprint actually means, how to measure it in a way that holds up to scrutiny, and where the real reduction opportunities are hiding in your supply chain.
Table of Contents
- What does carbon footprint mean for packaging?
- Where packaging emissions fit in your value chain
- Measuring and reporting packaging’s carbon footprint: Avoiding greenwashing
- Practical ways to reduce your packaging’s carbon footprint
- Why carbon footprint reduction in packaging is a team sport
- How Gather Packaging supports your carbon reduction goals
- Frequently asked questions
Key Takeaways
| Point | Details |
|---|---|
| Carbon footprint basics | Your packaging’s carbon footprint is the sum of greenhouse gas emissions from materials, manufacturing, transport, and end-of-life. |
| Scope 3 dominance | Most packaging emissions are Scope 3 and need value chain collaboration for real reductions. |
| Transparent reporting | Credible carbon claims require clear boundaries and audited, full lifecycle data to avoid greenwashing. |
| Practical reduction steps | Focus first on the biggest emission hotspots, then optimize design, materials, and logistics for measurable results. |
What does carbon footprint mean for packaging?
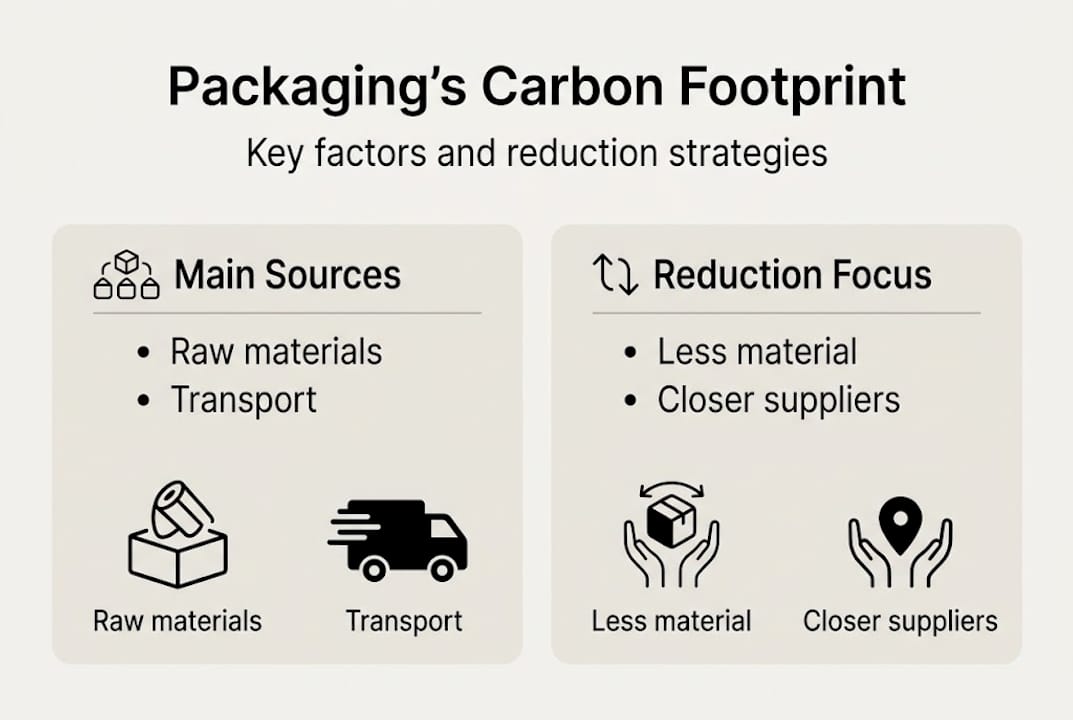
The term ‘carbon footprint’ gets used loosely, so let’s fix that. In a packaging context, your carbon footprint is the total sum of greenhouse gas emissions generated across every stage of a package’s life. That means raw material extraction, manufacturing, transportation to your facility, and what happens at the end of its useful life. It is measured in CO2 equivalents, a unit that accounts for different gases like methane and nitrous oxide alongside carbon dioxide.
This is different from general ‘eco’ claims, which often focus on a single attribute like recyclability or biodegradability. A bag can be technically recyclable and still generate significant emissions during production. Recyclability tells you something about end-of-life potential. It tells you very little about the energy burned getting the product to your loading dock.
The gold standard for measuring this accurately is a Life Cycle Assessment, or LCA. An LCA maps every input and output across a product’s life and assigns an emissions value to each stage. For packaging specifically, the Product Carbon Footprint, or PCF, is a narrower version of an LCA focused entirely on greenhouse gas emissions. Carbon footprint analysis in packaging is best handled using standardized lifecycle methods like LCA and PCF, per the PACT Methodology v3.0.
Two common boundary definitions shape what gets counted:
- Cradle-to-gate: Covers emissions from raw material extraction up to the moment the product leaves the factory.
- Cradle-to-grave: Covers the full lifecycle, including transport to customers, use phase, and end-of-life disposal or recycling.
- Material extraction: Logging, pulping, or petrochemical processing all carry their own emissions burdens.
- Manufacturing: The energy mix at the production facility matters enormously.
- Transport: Distance and mode of shipping add measurable carbon at each leg.
- End-of-life: Landfill, composting, or recycling each carry a different emissions outcome.
“A packaging carbon footprint calculated only to the factory gate can undercount total lifecycle emissions by 30 to 60 percent depending on product category and distribution model.” This is why boundary selection is one of the first decisions any credible carbon reporting program must document.
Understanding packaging sustainability explained at this level of detail separates brands that can back their claims from those that cannot.
Where packaging emissions fit in your value chain
Now that carbon footprint is clearly defined, let’s see where your packaging emissions truly show up on your company’s GHG inventory.
Most brands organize their emissions using the GHG Protocol’s three-scope framework. Scope 1 covers direct emissions from sources your company owns or controls, like a company-owned delivery vehicle. Scope 2 covers purchased electricity and heat. Scope 3 covers everything else in your value chain, upstream and downstream. For the vast majority of retail and foodservice operators, packaging emissions fall squarely in Scope 3.
| Packaging activity | GHG scope | Scope 3 subcategory |
|---|---|---|
| Purchasing raw paper or film packaging | Scope 3 | Category 1: Purchased goods and services |
| Inbound freight from supplier | Scope 3 | Category 4: Upstream transportation |
| Outbound packaging to customer | Scope 3 | Category 9: Downstream transportation |
| Customer disposal or recycling | Scope 3 | Category 12: End-of-life treatment |
| Packaging used in leased retail space | Scope 3 | Category 8: Upstream leased assets |
This framing matters because many sustainability programs at retail and foodservice brands focus inward. Teams track energy use in owned facilities and call it done. But if your packaging is purchased from an outside manufacturer, shipped by a third-party carrier, and ultimately disposed of by your customer, nearly all of the related emissions live in Scope 3 territory you are not directly controlling.
Main Scope 3 subcategories most affected by your packaging decisions:
- Category 1 (Purchased goods): The embedded carbon in the materials themselves, including the energy used to make them.
- Category 4 (Upstream transport): Freight miles and mode from supplier to your warehouse.
- Category 12 (End-of-life treatment): Whether the packaging ends up composted, recycled, or in a landfill.
Value chain optimization, not just vendor switching, is what moves these numbers. Choosing a closer manufacturer reduces Category 4 emissions without changing a single material. Investing in quality assurance for sustainable packaging reduces waste and the associated re-manufacturing emissions. And designing packaging efficiently, as outlined in guidance on how to design retail packaging efficiently, cuts material volume across the chain.
Pro Tip: Before you chase a lower-emission material supplier, run a hotspot analysis on your current data. Identify which Scope 3 category is your largest source. For most North American foodservice operators, inbound freight from overseas suppliers outweighs material-type differences by a significant margin.
Measuring and reporting packaging’s carbon footprint: Avoiding greenwashing
With emissions mapped, the next challenge is to credibly communicate your efforts without exaggeration or ambiguity.
The boundary you choose for your carbon footprint calculation is a statement about your brand’s honesty. Brands that report only cradle-to-gate numbers but market the result as their total carbon impact are leaving out transport, customer delivery, and end-of-life, stages that collectively can account for a large share of actual emissions.
| Reporting boundary | What’s included | What’s excluded | Risk level |
|---|---|---|---|
| Cradle-to-gate | Material extraction, manufacturing | Transport, use, end-of-life | High (partial picture) |
| Cradle-to-grave | Full lifecycle from extraction to disposal | Nothing, if done correctly | Low (complete picture) |
| Gate-to-grave | Transport, use, end-of-life | Material extraction, manufacturing | Medium (useful for logistics focus) |
Common mistakes that lead to greenwashing in packaging claims:
- Reporting only the factory energy use without including upstream material emissions.
- Claiming carbon neutrality based on offsets without disclosing the quality or permanence of those offsets.
- Using emissions factors that are generic industry averages rather than supplier-specific data.
- Omitting end-of-life emissions because they are difficult to estimate.
- Changing boundary definitions between reporting periods without disclosure.
Carbon footprint claims in packaging programs need to avoid greenwashing by using auditable, transparent calculations and clear boundaries, per the PACT Methodology v3.0. That means documenting every assumption, disclosing your data sources, and being explicit about what is and is not included.
In North America, consumer sensitivity to greenwashing is accelerating. Regulatory scrutiny from the FTC’s Green Guides and Canadian Competition Bureau guidelines means that vague or unsubstantiated sustainability claims carry real legal and reputational risk. Linking your sustainable branding best practices to verified carbon data is no longer optional for brands that want to be taken seriously.
Practical ways to reduce your packaging’s carbon footprint
Having covered measurement and reporting, here’s how you actually cut emissions in your day-to-day packaging choices.
Reduction starts with knowing where emissions are largest. Prioritizing hotspots, the largest drivers, then redesigning for right-sizing, lightweighting, increasing recycled content, and optimizing logistics is the proven sequence for meaningful reductions.
- Map your current packaging inventory and assign an emission estimate to each SKU using supplier-provided data or publicly available emissions factors.
- Identify hotspots by ranking packaging types or supply chain legs by their carbon contribution per unit shipped.
- Apply lightweighting where structurally possible. Reducing a paper bag’s basis weight by 10 percent can cut material-related emissions proportionally without sacrificing performance.
- Right-size your packaging to eliminate dead space. Oversized bags require more material and reduce truck fill rates, both of which add emissions.
- Increase recycled content where supplier data confirms it genuinely displaces virgin fiber production. Not all recycled content claims are backed by solid chain-of-custody documentation.
- Audit your logistics for unnecessary freight legs. A domestic manufacturer often beats an overseas supplier on total carbon even if the unit price is higher.
- Pilot one change, measure it, then scale. Iterative improvement beats large-scale overhauls that are hard to measure and harder to attribute.
Logistics optimizations that directly cut packaging waste and emissions:
- Increasing truck fill rate by nesting or flat-packing bags before shipment.
- Consolidating supplier shipments to reduce partial-load freight.
- Choosing manufacturers with shorter supply chains to reduce transport-leg emissions.
- Reviewing your eco-friendly packaging workflow to remove redundant steps that add carbon without adding value.
- Aligning packaging design with your sustainable packaging workflow so that sustainability is built in from the design stage.
Pro Tip: The brands that make the most consistent progress are the ones that improve their data quality first. Better data reveals bigger opportunities. If you are working from industry-average emissions factors, upgrading to supplier-specific data is often the single action that unlocks the next round of real reductions.
Why carbon footprint reduction in packaging is a team sport
Here is the pattern we see most often: a sustainability manager runs a carbon analysis, identifies a lower-emission material, and switches suppliers. Six months later, procurement reverses the decision because the new supplier has longer lead times. Marketing has already published the claim. And nobody checked whether the new material’s transport emissions offset any material-level gains.
This happens when sustainability sits in one silo. Real carbon reduction in packaging requires procurement teams choosing suppliers on total carbon cost, not just unit price. It requires marketing teams who will only publish claims tied to auditable data. And it requires leadership that treats LCA data as an operational input, not a communications tool.
Yesterday’s material swap is tomorrow’s PR trap when end-to-end data is missing. The brands doing this well pilot small changes, measure the actual outcome, and only broadcast improvements that are audit-ready. Packaging compliance and collaboration across teams is what separates credible sustainability programs from expensive marketing exercises. Cross-functional accountability, not better materials alone, is the mechanism that produces lasting reductions.
How Gather Packaging supports your carbon reduction goals
Ready to turn your packaging knowledge into action? Here’s how Gather Packaging can help.
At Gather Packaging, we produce FSC-certified, recycled-content paper bags from our Toronto facility, which means shorter supply chains, lower transport emissions, and faster turnaround for North American brands. Our team works with you from design through logistics to identify where your packaging value chain can be leaner and lower-carbon.
Explore our sustainability-focused products to see how our materials and certifications align with your carbon reporting needs. When you are ready to compare options, browse our full range of eco-friendly packaging products and connect with our team for a customized solution that fits your supply chain and your sustainability targets.
Frequently asked questions
Why is packaging’s carbon footprint usually Scope 3?
Packaging emissions come from materials purchased and waste handled outside your own operations, so they are typically classified as Scope 3 under the GHG Protocol framework.
Does using recycled content always cut carbon footprint?
Not always. Recycled content cuts upstream emissions only when it genuinely replaces virgin material and is supported by verified supply chain data.
How can I avoid greenwashing with my packaging claims?
Use third-party verified carbon calculations, clearly state your reporting boundaries, and disclose end-of-life emissions separately if they are not already included, as PACT Methodology v3.0 requires.
What’s the first step to lowering my packaging’s carbon footprint?
Start by mapping where emissions are highest in your packaging value chain. Hotspot analysis almost always points to material extraction or manufacturing as the largest driver.
Share:
Shopping bag lamination: benefits, materials & sustainability
Best types of custom shopping bags for sustainable retail